HANS ULRIK RIISGÅRD
MARINE BIOLOGICAL RESEARCH CENTRE


HANS ULRIK RIISGÅRD
Personal homepage
About
Considering the dominant role of phytoplankton in the primary production in the sea, it is understandable that filter feeding – or suspension feeding – is of widespread occurrence and filter feeders are found in almost all animal classes represented in the sea. Filter-feeding animals are necessary links between the suspended phytoplankton and higher trophic levels in the marine food chains. A large number of filter-feeding animals like bivalves, polychaetes, ascidians, bryozoans, and sponges graze on the phytoplankton in near-bottom water, and particular in shallow coastal waters and fjords they may exert a pronounced grazing impact which may keep the water clear (but not clean) in eutrophicated areas. My research deals with a number of related topics: bioenergetics and energy budgets, functional response, filter-pumps and energetic cost of filter-feeding, adaptation to environment, water pumping and particle retention efficiency, particle capture mechanisms, switching between deposit and filter-feeding, grazing impact of benthic filter-feeders, and predation impact of jellyfish. Further, plankton dynamics and environmental assessment, mussels as pollution indicators and the importance of filter-feeding bivalves for the uptake of pollutants in the marine grazing food chain form part of my research profile.
Key words: filter-feeding in marine invertebrates; bioenergetics (food-uptake, assimilation, respiration, energy budgets, growth, costs of growth, growth efficiency); biological filter-pumps; biomixing; fluid mechanics; population grazing impact; particle capture mechanisms; benthic-pelagic coupling; biological structure and nutrient dynamics; grazing impact of benthic filter feeders; implications of density driven currents for interaction between jellyfish and zooplankton
Tentacle crown of a filter-feeding worm (Euchone papillosa) living at 75 m depth in the Gulmarsfjord on the Swedish westcoast.
Brzoyoan Electra capturing an algal cell (6 µm diameter) in its tentacle crown by tentacle flicking.
Publications
The Publication list consists of some 248 titles: peer-reviewed papers in English (1977-present, about 193 titles) and publications in Danish (55 titles)
- Highly Ranked Scholar
- Google Scholar (h-index = 64; citations = 13,026)
- ResearchGate (h-index = 61; citations = 11,537)
- Peer-review record & Award on Publons
Projects
Ongoing project III: Mytilus edulis
Evolutionary and ecological success of sponges – the world’s simplest animals
Water processing and bio-mechanical characterization of filter-feeding jellyfish
Marine bio-production and shellfish research (MarBioShell)
Flume facility co-operation network for biological benthic boundary layer research (BioFlow)
Peer-review debate
Ongoing debate about the peer-review system Download pdf
Further Contributions invited!
Contact: Initiator and Editor H.U. Riisgård (MEPS Review Editor, hur@biology.sdu.dk)
Marine Biological Research Centre, University of Southern Denmark, Hindsholmsvej 11, DK-5300 Kerteminde, Denmark
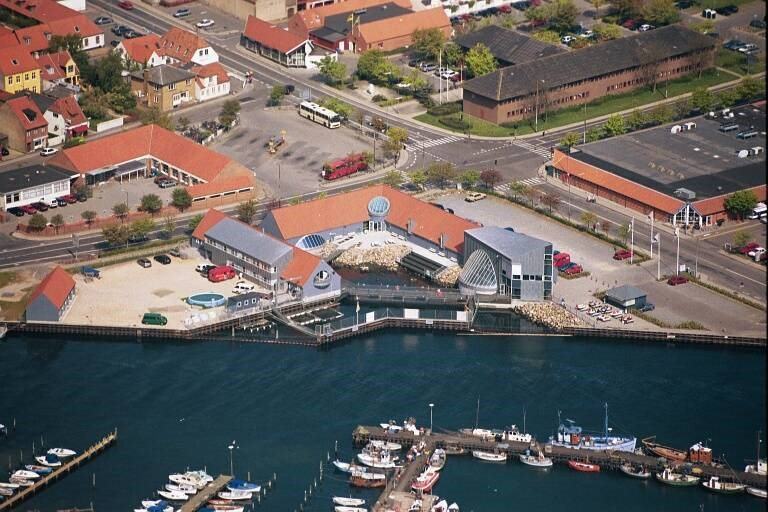
Marine Biological Research Centre
For further information, please see official Homepage: Marine Biological Research Centre
Marine Biological Research Centre 2011
Fjord Biological Laboratory
In 1991, I established the small Fjord Biology Laboratory in Kerteminde. This was made possible by means of support from national research projects, private funds, donations and extensive support from the municipality of Kerteminde. The official opening was 11 June 1991 (see pictures below). In 1993 the running expenses of the Fjord Biology Laboratory was taken over by the University of Southern Denmark, and a few years later in 1997 the Fjord Biology Laboratory became an annex to the nearby new Marine Biological Research Centre. However, I still have my office at the Fjord Biological Laboratory, Grønlandsgade 14, 5300 Kerteminde. The laboratory which includes an 100 squaremeter aquariumhall with running seawater from the fjord-inlet is specialized in research on filter-feeding marine invertebrates, and most of my research is performed here and in the neary Kerteminde Fjord/Kertinge Nor. – Hans Ulrik Riisgård, 5 March 2016


25 years-anniversary, 11 June 2016
- 25-years anniversary
- Kjerteminde Avis – 13 June 1991
- Fyens Stiftstidende – 19 June 2016
- “Da universitetet kom til Kerteminde – Fjordbiologisk Laboratorium 1990-2020“, Cartha 2020
Kerteminde Fjord
The fjord-system consisting of Kerteminde Fjord and Kertinge Nor (Fig. 1) covers an area of 8.5 km2 and has a mean water depth of approximately 2 m and a maximum depth of 8 m. The fjord has a sill at its mouth to the open sea (Great Belt). The discharge over the sill is forced by a diurnal tide with an average amplitude of approximately 20 cm. The tide gives rise to maximum discharges at the fjord entrance of 100-200 m3 s-1. The fresh water input of 0-0.05 m3 s-1 is negligible with respect to the water exchange of the fjord-system. The salinity in the central part of the system varies typically between 14 and 22 ‰ over the year. The temperature ranges between 0 and 22 Celcius degrees.

Figure 1 Map of Kerteminde Fjord/Kertinge Nor
Water exchange of the fjord-system is governed by density driven circulation. The salinity in the Great Belt outside the fjord varies as a result of changing flow situations. Outflow of water from the Baltic Sea gives salinities down to 10 ‰ whereas inflow to the Baltic Sea gives salinities up to 27 ‰ in the upper layer of the Great Belt. Because saline water is more dense than fresh water the salinity variations cause longitudinal density variations from the inner part of the fjord-system to the mouth. As a consequence of longitudinal density gradient, density driven vertical circulation occurs. When dense water by tidal forcing is flushed over the sill it will flow down below the fjord water and give rise to a density driven circulation system within the entire fjord-system. When, on the other hand, light water is forced into the fjord the circulation is in the opposite direction. On an annual time scale the two circulation directions have equal probability. A qualitative illustration of the strength and the direction of the exchange of water is given in Fig. 2.
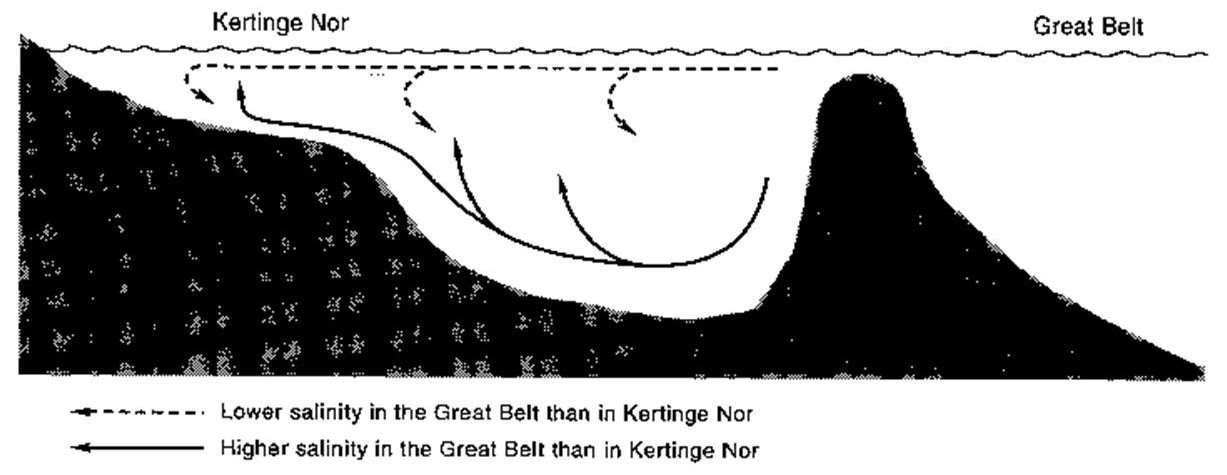
Figure 2 Kerteminde Fjord/Kertinge Nor. Density-driven water circulation
Kertinge Nor
The biological structure of the shallow cove of Kertinge Nor in the inner part of Kerteminde Fjord is shown in Fig. 3. The water column is often extremely clear which allow sufficient light penetration to the bottom where a significant benthic primary production of filamentous algae and eelgrass may be found. The dense algal mat is important for the control of the nutrient flux from the sediment into the water column. Below the algal mat the sediment is black and sulphidic due to anoxic conditions and without living animals.

Figure 3 Biological structure in Kertinge Nor during summertime. Three food-chains may be identified: 1) phytoplankton → ascidians (Ciona intestinalis), 2) epiphytic diatoms → epibenthic harpacticoids → jellyfish (Aurelia aurita) and sticklebacks, 3) macrophytes → detritus → decomposing microorganisms.
The water processing capacity of the jellyfish population is very high, with a maximum rate obtained in early September, where the jellyfish population daily may process a water volume corresponding to approximately 13 times the whole water volume of Kertinge Nor. This shows that Aurelia aurita can control zooplankton in the cove during summer and fall.
Laboratory experiments have proved that the medusae are food limited at in situ zooplankton concentrations found during daytime. However, the density of harpacticoids in the water column during night can exceed the density during day by a factor of 20 and night-swimming harpacticoids may therefore be an important food source for the jellyfish in Kertinge Nor.
The filter feeding Ciona intestinalis (Fig. 4) may exert a high grazing pressure on phytoplankton which partly explained the low observed phytoplankton biomass. In particular, during late summer and fall, theCiona population can reach densities of approximately 250 individuals per m2. During fall, the dense population of C. intestinalis has the potential capacity to filter the total water volume of Kertinge Nor 0.2 to 1.2 times daily, and the mean residence time of an algal cell in the water column (t½) may only be about 7 hours in September.

Figure 4 Filter-feeding ascidians (Ciona intestinalis) in Kertinge Nor
The Great Belt
The Great Belt is part of the 3 Danish straits (the Great Belt, the Little Belt and the Sound) connecting the brackish Baltic Sea with the saline North Sea. The water depth in the straits is shallow with typical depths between 10 and 20 m. In the Great belt the boundary toward the Baltic Sea is given by the Darss sill at a depth of approximately 17 m. Towards the North the boundary between the Kattegat and the Skagerak is given by the sloping bottom toward the deep Norwegian Trench (Fig. 5).
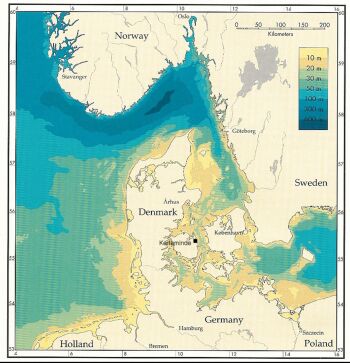
Figure 5 Bathymetry of Danish waters. The Danish straits constitute a transition zone between the brackish Baltic Sea and the saline North Sea. The Great Belt is the middle of the 3 straits.
With respect to hydrography, a distinction is made between the net and the instantaneous flow condition in the Great Belt. The net current is northbound due to the surplus of freshwater flow into the Baltic. Due to the general estuarine circulation caused by the density gradient from the Baltic to the North Sea the mean current in the upper layer is directed out of the Baltic whereas the mean current in the bottom layer is directed towards the Baltic (Fig. 6). The instantaneous flow condition, though, is governed by the actual water level difference between the Kattegat and the western Baltic as well as the estuarine circulation. The dominating forcing is here the combined effect of meteorological forcing (wind and solar heating) and tidal forcing. Hence, with irregular intervals, on a time-scale of days, the flow through the Great Belt is seen to oscillate between south- and northbound with peak discharges being 10 to 15 times the mean discharge. The variable density in the Great Belt associated with this dynamic hydrographical system assists in maintaining the density driven circulation and water exchange in e.g. the Kerteminde fjord-system and the Odense Fjord with openings to the Great Belt.
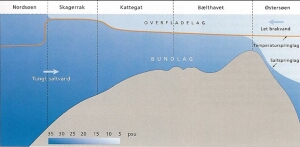
Figure 6 North-South transect through Danish waters, that are characterized by large horizontal salinity differences (psu = from 8 to 35). Less salty and thus lighter brackish water flows northward in the surface while a more salty layer near the bottom flows southward.
Odense Fjord
The total area of Odense Fjord is 60 km2, the outer fjord is about 50 km2 with a mean depth of 2.7 m and the inner fjord is about 10 km2 with a mean depth of 0.8 m. The catchments area to the fjord is, large, approximately 1,000 km2 (about one third of the island of Fyn) most of which is agricultural land; the freshwater enters the fjord mainly via Odense River (Fig. 7). In 2000, Odense Fjord received 2,300 tonnes of nitrogen and 54 tonnes of phosphorus. Due to this high loading, Odense Fjord is eutrophicated.

Figure 7 Odense Fjord viewed from Odense facing northeast. Photo: J. Kofoed Winther.
Odense Fjord is characterized by a large biomass of filter-feeding polychaetes (Nereis diversicolor), clams (Mya arenaria) and cockles (Cerastoderma glaucum), which together make up about 70 % of the total animal biomass. Other species of bivalves in Odense Fjord are Mytilus edulis, Macoma balthica, Scrobicularia plana, and Ensis sp.
Compared to other shallow marine waters, the density of the facultatively filter-feeding Nereis diversicolor is unusually high in the inner part of Odense Fjord, and therefore it has been assumed that N. diversicolor along with Mya arenaria and Cerastoderma glaucum (Fig. 8) play an essential role for the regulation of the biomass of phytoplankton in the inner part of the fjord. The grazing impact of the filter-feeding zoobenthos in Odense Fjord, with focus on the inner part, has recently been studied.
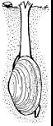
Figure 8 Mya arenaria
The distribution of Nereis diversicolor, Mya arenaria and Cerastoderma glaucum in the shallow Odense Fjord were mapped in 2000 and the data showed that these three dominating species of benthic filter-feeding macro-invertebrates can filter a volume equivalent to the total volume of water in the inner part of the fjord in Q = 0.29, 0.46 and 4 d, respectively, and that the potential grazing impact, expressed as mean residence time of phytoplankton under well mixed conditions, is t½ = 0.20, 0.32 and 2.8 d, respectively. The total potential grazing impact exerted by the three species is Q = 0.17 d and t½ = 0.12 d or less than 3 h. This indicates that especially N. diversicolor and M. arenaria may exert a pronounced controlling impact on the phytoplankton in the inner part of Odense Fjord. However, it must be emphasised the estimated grazing impacts are potentials that may only be realised if a decisive prerequisite is fulfilled, namely that the filter-feeding animals on the bottom are exposed to the whole water column by effective vertical mixing of the water. In the shallow inner part of Odense Fjord with a mean depth of only 0.8 m the water may often be well mixed by wind action. More systematic studies with focus on this problem are now in progress.
Surplus of nutrients has increased the biomass of macroalgae, such as sea lettuce Ulva lactuca and horsehair seaweed Chaetomorpha linum which appear in large quantities in the fjord during the summer (Fig. 9). In the 1980’s, U. lactuca appeared in the inner part of the fjord during summer with extremely high biomasses (1 kg dry mass per m2) and with an annual production of about 1000 tons of carbon, or twice the annual phytoplankton production in the same area. Since then especially the phosphorus and the summer-nitrogen loads have decreased, coincidently with a decrease in the abundance of macroalgae in the fjord.

Figure 9 Mass occurrence of sea lettuce (Ulva lactuca) in the inner part of Odense Fjord.
PUBLICATION FROM 2008 ABOUT ODENSE FJORD, KERTINGE NOR AND KERTEMINDE FJORD (PDF)
Article in Danish about Kertinge Nor (Artikel fra Kaskelot nr. 114, 1997)
Teaching
Over the years I have been responsible for teaching and establishing of several courses at all levels:
- Marine- & Brackish Water Ecology BB506: laboratory and field course for basic natural science students
- Bioseminarer BB534 Bachelor course
- General Ecology: which forms part of a course in ‘Environmental Biology’ BB01 on the basic education in natural sciences at Odense University which was yearly followed by approximately 200 new students. For this course I have written a textbook (‘Basisbog i Økologi’, Gads Forlag 1990).
- Fjord Biology BB49: advanced laboratory and field course with emphasis on experimental ecology.
- Suspension-Feeding BB48: advanced theoretical course mainly based on reading of original scientific literature.
- Marine Biology BB47: advanced course in marine biology.
- Biological Oceanography: a 2-year master programme consisting of compulsory courses, elective courses and a research project. First year: basic studies in oceanography at the University of Kiel followed by advanced courses in oceanography and resource management at the University of Southern Denmark. Second year: research project in Biological Oceanography carried out either in Kiel or in Odense and may be experimental or oriented towards administration/management.
Additionally to the obligatory teaching, I have held more than 50 guest lectures and talks at home and abroad, supervisor for about 50 candidate research-projects (M.Sc.) and 7 Ph.D. projects.
Member of the Danish censor corps for university biology.
Students, guest researchers and assistants
- Marianne Croue, Internship, Ecole de Biologie Industrielle, France (June – August 2022)
- Théophile Magnac, Internship, Ecole de Biologie Industrielle, France (June – August 2022)
- Louise Roulund Buur, MSc project (February 2019 – February 2020)
- Mehdi Gadour, MSc student, ERASMUS traineeship (February – June 2019)
- Juliette Caron, Internship, Ecole de Biologie Industrielle, France (June – August 2019)
- Mikkel Keller Lees, Bachelorproject (June 2019)
- Rachael Alexandra Kealy, MSc project (June 2018)
- Thomas Busk, Bachelorproject (June 2018)
- Lena Raudenkolb, Research Project II (10 ECTS, June 2018)
- Rasmus Jarnved Kjær, Individual study activity, IABB501 (5 ECTS, June 2018)
- Mikkel Keller Lees, Individual study activity, IABB501 (5 ECTS, June 2018)
- Jakob Jaensch Rasmussen, Individual study activity, IABB501 (5 ECTS, June 2018)
- Matthew Lee Gravener, MSc student, Research Project III, BB810 (January – July 2017)
- Camille Prigent, Internship, Ecole de Biologie Industrielle, France (June – August 2017)
- Mathilde Quemard, Internship, Ecole de Biologie Industrielle, France (June – August 2017)
- Kathrine Habekost Hansen, Bachelor project (January – June 2017)
- Janni Magelund Degn Larsen, Bachelor project (January – June 2017)
- Rachael Alexandra Kealy, MSc student, Research Project I, BB810 (November 2016 – January 2017)
- Lars Kumala, Ph.D.-student, 3 years with start 15 January 2014: “Ecophysiology and biodemography of aging sponges” (co-supervisor)
- Josephine Goldstein, Ph.D.-student, 3 years with start February 2013: “Life history stages of the moon jellyfish Aurelia aurita – towards a demographic understanding of jellyfish blooms” (co-supervisor).
- Clémentine Prat, Internship, Ecole de Biologie Industrielle EBI (EBI), France (20 June – 20 August 2016)
- Thibault Neveu, Internship, Ecole de Biologie Industrielle EBI (EBI), France (20 June – 20 August 2016)
- Katerina Charitonidou, ERASMUS trainee from Greece (1 October 2015 – 31 December 2015), and student helper on sponge project (1 January – 30 April 2016)
- Nicole Patricia Jones, MSc project from 15 February 2015 – 8 April 2016: “Microplastic contamination in the freshwater mussel Dreissena” (main supervisor)
- Baojun Tang, postdoc from Shanghai, China, visiting scholar financed by China Scholarship Council in one year (August 2014 – August 2015)
- Mie Thorborg Pedersen, MSc project: “Gastrophysical investigation of jellyfish”, with start 18 December 2014 (co-supervisor)
- Adrian Garcia Lopez, ERASMUS trainee (civil engineer) from Spain (18 January 2016 – 18 April 2016)
- Camille Gros, Internship, Ecole Biologie Industrielle, France (15 June – 15 August 2015)
- Sébastien Delaunay, Internship, Ecole Biologie Industrielle, France (15 June – 15 August 2015)
- Per Andrup, research assistant (engineer within electronics) in the period December 2014 to June 2015
- Jan Brandt Wiersma, Internship, Van Hall Larenstein University, The Netherlands (September 2014 – February 2015)
- Florian Lüskow, ERASMUS placement, University of Bremen, as part of master study co-supervised by external supervisor, Hans Ulrik Riisgård, University of Bremen (15 June – 15 November 2014)
- Nathanaël Jeune, Internship, National school for water and environmental engineering of Strasbourg (ENGEES, 5 May – 1 August 2014)
- Adèle Doucet, Internship, Ecole Biologie Industrielle (EBI), France (23 June – 23 August 2014)
- Marion Hatton, Internship, Ecole Biologie Industrielle (EBI), France (23 June – 23 August 2014)
- Anastasia Yurtseva, Ph.D., junior researcher, Saint Petersburg State University, 9 months visit (1 December 2013 – 31 August 2014)
- David Z. Domench, Leonardo da Vinci grant trainee (28 October 2013 – 30 May 2014)
- Ruben van Beek, Van Hall Larenstein trainee placement (1 September 2013 – 31 January 2014)
- Lucia Carlota Merino Gonzalez Pardo, ERASMUS placement (July – September 2013)
- Magali Mulot, practical placement in engineering (2 May – 27 July 2013)
- Ana Torrano Lozano, Leonardo da Vinci grant trainee (December 2012 – June 2013)
- Kadri Kuusemäne, Individual study activity: “Filtration activity of the mussel Mytilus edulis” (10 ECTS, start September 2012)
- Meinhard Meiners-Hagen, Individual study activity: “Filtration activity of the mussel Mytilus edulis” (5 ECTS, start September 2012)
- Shannon Tunney, Individual study activity: “Filtration activity of the mussel Mytilus edulis” (10 ECTS, start September 2012)
- Susan Guldberg Graugård Petersen, BSc project: “Biologiske og hydrografiske faktorer af betydning for populationsdynamikken mellem Aurelia aurita og Mnemiopsis leidyi i Limfjorden” (afsluttet 30. september 2012)
- Maria Àngeles Provencio López, Leonardo da Vinci grant trainee (November 2011 – May 2012)
- Florian Lüskow, Guest student: “Effects of salinity-changing rates on feeding behaviour of blue mussels (March – June 2012)
- Daniel Pleissner, Ph.D. project: “Bioproduction and bioenergetics – bio-reactor production of microalgae and growth of filter-feeding bivalves” (April 2009 – April 2012)
- Jakob Sten Knudsen, BSc project: “Food uptake and growth of the blue mussel Mytilus edulis at high algal concentrations – physiological regulation versus overloading of digestive system” (afsluttet 27. oktober 2011)
- Line Bøttiger, Specialeprojekt: “Growth of blue mussels, Mytilus edulis, and effects of salinity and current speed” (afsluttet 25. marts 2011)
- Parnuma P. Egede, Specialeprojekt: “Food uptake and growth of blue mussels (Mytilus edulis) – a combined laboratory and field study” (afsluttet 15. september 2010)
- Isabel Barreiro Saavedra, Leonardo Da Vinci training placement (February –July 2010)
- Sandrine Serre, Internship with 30 ECTS individual study, Toulouse: “Clearance of jellyfish measured by means of new ingestion-method” (finished October 2010)
- Christina Vinum Thoisen, BSc project: “Viskositetens versus temperaturens effekt på filtrerings- og svømmehastighed målt på forskellige livsstadier af saltvandskrebs, Artemia salina” (afsluttet juni 2010)
- Sasia Johansen, BSc project: “Temperaturen versus viskositetens indflydelse på øregoplens, Aurelia aurita, klokkeslagfrekvens og filtrationsrate” (afsluttet august 2010)
- Lærke Arentoft Johansen, BSc project: “Faglig formidling i praksis – Formidling af MarBioShell-projektet til tre målgrupper” (afsluttet september 2010)
- Sabrina Maria Nothlev Sørensen, BSc project: “Faglig formidling i praksis – Formidling af MarBioShell-projektet til tre målgrupper” (afsluttet september 2010)
- Coralie Barth, Specialeprojekt: “Growth rates of the invasive ctenophore Mnemiopsis leidyi – a combined field and laboratory study, with special emphasis on population dynamics” (afsluttet 19. march 2010)
- Ana Mercedes Orts Pérez, Leonardo Da Vinci training placement (July 2009 – January 2010)
- Caroline-Marie Vandt Madsen, Specialeprojekt: “Ecological role and interspecific competition of jellyfish” (afsluttet 15. december 2009)
- Christine Røllike Ditlefsen, Specialeprojekt: “Feeding ecology of the American comb jelly Mnemiopsis leidyi” (afsluttet 15. september 2009)
- Coralie Barth, Individual study activity: “Clearance rate of the comb jelly Mnemiopsis leidyi” (31 ECTS, afsluttet juni 2008)
- Inmaculada Martín Arnau, Leonardo Da Vinci training placement (July 2008 – January 2009)
- Morten Jørgensen, BSc project: “Effekt af temperatur og viskositet på filtrationshastigheden hos søpungen Ciona intestinalis” (finished May 2008)
- Nikolaj Gedsted Andersen, Specialeprojekt: “The plankton structure in the Sargasso Sea – a study of secondary production in the spawning area of the European eel (Anguilla anguilla)” (afsluttet oktober 2008)
- Helena Moos Nielsen, Specialeprojekt: “Hydrodynamik og filtrerende muslingers betydning for fordelingen af fytoplankton i det centrale Lillebælt” (afsluttet oktober 2008)
- Cornelia Jaspers, Specialeprojekt: “The role of larvaceans (appendicularians) in the food web of the Southern Indian Ocean” (afsluttet maj 2008)
- Michael Fülberth, Specialeprojekt: “Growth rates of juvenile Atlantic cod (Gadus morhua) held under different photoperiods and feeding regimes” (afsluttet april 2008)
- Line Bøttiger, BSc project: “Effekt af havvands temperatur og viskositet på vandmandens (Aurelia aurita) svømning og effektivitet af byttedyrfangst” (afsluttet juli 2007)
- Caroline-Marie Vandt Madsen, BSc project: “Øregoplen (Aurelia aurita) og dens byttedyr – effekt af temperatur og viskositet (afsluttet juli 2007)
- Peer Schotge, Individual study activity (4 months): “Switching between surface deposit feeding and filter-feeding in the amphipod Corophium volutator” (afsluttet december 2006)
- Martin Kortegaard, Specialeprojekt: “Skift mellem deposit- og suspensionsernæring hos slikkrebsen Corophium volutator” (afsluttet juli 2005)
- Morten Iversen, Specialeprojekt: “Styrende mekanismer for udsynkning og nedbrydning af copepod-fækalier i det marine miljø” (afsluttet december 2005)
- Christine Røllike Ditlefsen, BSc project: “Kultivering af gopler” (afsluttet juli 2006)
- Martin Kortegaard Pedersen: “Skift mellem deposit- og suspensionsernæring hos slikkrebsen Corophium volutator” (July 2005)
- Christina Kittner: “Algekoncentrationens og temperaturens effekt på filtrationshastigheden hos muslinger” (January 2005)
- Johan Lassen: “Samspil mellem hydrografi, planktonalgedynamik og filtreringsaktivitet hos populationer af blåmuslinger, Mytilus edulis” (July 2004)
- Ole Moeslund: “Filtration hos gopler” (November 2003)
- Lene Friis Møller: “Slikkrebsen Corophium volutator som biologisk filter” (November 2003)
- Dorthe Fischer Seerup: “Filtrationsbiologiske studier af sandmuslingen Mya arenaria” (January 2003)
- Eroteida Jiménez Tejero, ERASMUS/Socrates exchange student from the University of Barcelona, Spain: “Indification of lower algal-concentration level for cessation of filter-feeding activity and siphon closure in the soft clam Mya arenaria” (November 2000 – January 2001; final report approved by SDU)
- Pernille Hermansen: “Fødeoptagelse og kolonivækst hos marine bryozoer: betydning af strømhastighed” (March 2000)
- Tommy Christensen: “Funktionel respons hos ferskvands-copepoden Cyclops vicinus” (MArch 2000)
- Robert Gardner, ERASMUS/Socrates exchange student: “Bryozoan growth in a Danish fjord system as related to algal biomass” (September – December 1999; final report approved by the University of Reading, UK)
- Alan Nielsen: “Individtæthed, vækst og fødeoptagelse hos copepoden Tisbe holothuriae” (april 1999)
- Hannah S. P. Bøttzau: “Vandloppers rolle i planktonomsætning i tempererede kystnære marine økosystemer – belyst ved sækkeforsøg” (August 1997)
- Camilla Frandsen: “Søpungen Ciona intestinalis: Retentionseffektivitet og bentho-pelagisk kobling i Kertinge Nor – med focus på fritlevende pelagiske bakterier” (August 1996)
- Annika Sundberg Jensen: “Benthisk-pelagisk kobling og søpungen Ciona intestinalis i Kertinge Nor – betydningen af hydrografiske forhold” (August 1996)
- Annette Strarup Nielsen: “Hydrografi og forekomst af vandmanden Aurelia aurita i Kertinge Nor” (June 1996)
- Kristian Toft Frandsen: “Vækst og respiration hos øregoplen Aurelia aurita” (June 1996)
- Annemarie Westh Pedersen: “Zooplanktondynamik i Kertinge Nor of Kerteminde Fjord. Betydningen af hydrografi og den almindelige vandmands prædation” (June 1996)
- Britta Tarp: “Vækst, respiration og graveaktivitet hos sandormen Arenicola marina” (Januar 1996)
- Inge Berntsen: “Sandormens (Arenicola marina) fødebiologi med specielt henblik på pumpe- og graveaktivitet” (august 1995)
- Ib Clausen: “Vækst, filtration og respiration hos blåmuslingen (Mytilus edulis)” (June 1995)
- Liselotte Poulsen: “Suspensionsernæring hos polychæten Nereis diversicolor: betydningen af et bundnært, fytoplankton-reduceret grænselag” (June 1995)
- Søren Thomas Thomassen: “Vækst og bioenergetik hos brødkrummesvampen Halichondria panicea” (March 1995)
- Torben Jarlstrøm Clausen: “Søpungen Ciona intestinalis i Kertinge Nor: græsningspotentiale, bentho-pelagisk kobling og hydrografi” (august 1995)
- Annemette Marie Nielsen: “Vækst og respiration hos polychæterne Nereis diversicolor (fakultativ filter-feeder) og N. virens (omnivor) – et komparativt studie”(January 1995)
- Stefan Mayer*: “Particle motion in unsteady three-dimensional flow at low Reynolds numbers” (main supervisor Prof. P.S. Larsen, DTU Copenhagen; March 1994)
- Jens Kjerulf Petersen*: “Søpungen Ciona intestinalis – en filtrator i en lavvandet fjord” (April 1994)
- Niels Jørn Olesen*: “Ecology of jellyfish. Population dynamics, feeding, growth and influence on the biological structure in shallows fjords” (March 1994)
- Anders Vedel: “Suspensionsernæring hos polychæten Nereis diversicolor” (May 1993)
- Susanne Hansen: “Kviksølvs ophobning og omsætning i skrubber Platichtys flesus” (June 1989)
- Hans Chr. Christiansen: “Akkumuleringseffektivitet af cadmium i marine dyr” (February 1988)
- Jakob Kryger: “Filtrationsrater og bioenergetik hos ferskvandsmuslinger” (June 1987)
- Niels Riis: “Fødeoptagelse hos haletudser” (January 1987)
- Kirsten Nielsen: “Svampemidlers effekt vurderet ved gærsvampe-væktsmodel, samt undersøgelse af nogle tungmetaller og selens effekt på gærsvampes vækst” (August 1986)
- Johanne Jensen: “Fødeindtagelse, ægproduktion og fedtsyresammensætning hos den marine planktoniske copepod Acartia tonsa” (June 1987)
- Kaisa Toudal: “Subletale effekter af cadmium på copepoder” (December 1986)
- Eilif Gaard: “En undersøgelse af mulighederne for at dyrke blåmuslinger i en færøsk fjord” (September 1986)
Invasive species
Dræbergoplen i danske farvande
Hans Ulrik Riisgård, professor, ph.d. & dr. scient.
Marinbiologisk Forskningscenter (Syddansk Universitet), Hindsholmvej 11, 5300 Kerteminde Email: hur@biology.sdu.dk
_________________________________________________________________________
En hidtil ukendt ribbegople i danske farvande blev i sommeren 2007 for første gang observeret i større mængder, især i Limfjorden. Ribbegoplen (Mnemiopsis leidyi), der i pressen fik navnet “dræbergoplen”, er kendt som en invasiv art i Sortehavet, hvor den gjorde stor skade på fiskeriet i slutningen af 1980’erne. Måske er dræbergoplen ved at etablere sig permanent i de danske farvande. Derfor følges udviklingen, blandt andet genne folkelige indberetninger, da der ikke findes noget officielt overvågningsprogam, som indbefatter gopler.
_________________________________________________________________________
Ribbegople ødelægger fiskeriet i Sortehavet
I begyndelsen af 1980’erne dukkede en oprindelig østamerikansk ribbegople op i Sortehavet. Denne ‘dræber-ribbegople’, Mnemiopsis leidyi – udtales “nemi-opsis” – var utilsigtet blevet indslæbt med tankskibenes ballastvand. I de følgende år tog ribbegoplen imidlertid eksplosivt til i antal, og i 1988 udviste den masseforekomst. Sammenfaldende med ribbegoplens tiltagende udbredelse og tæthed observeredes en drastisk reduktion de zooplankton-organismer, som ribbegoplen lever af. Konsekvensen var et totalt sammenbrud af Sortehavets store fiskeri af især ansjos og brisling, der lever af zooplankton, især vandlopper (copepoder). Men også fiskeriet af hestemakrel, der lever af de zooplankton-ædende småfisk gik dramatisk ned. Ribbegoplerne havde ædt ikke blot fiskenes føde, men også påvirket fiskebestandene direkte ved at æde fiskenes æg og nyklækkede larver. Fra Sortehavet spredtes Mnemiopsis-ribbegoplen i de næste 2-5 år til det Asovske hav, Marmarahavet, det Agæiske hav, det østlige Middelhav og til det Kaspiske Hav med de samme fatale økologiske og økonomiske skader som i Sortehavet (Fasse & Bayha 2006, Wagget & Sullivan 2006).
Mnemiopsis-ribbegoplen kommer til Holland
I august og november 2006 registreredes den invasive Mnemiopsis-ribbegople for første gang langs den hollandske kyst, ofte i ekstremt store mængder. Ballastvand fra de store skibe, som anløber Antwerpen og Rotterdam, havde bragt ribbegoplen til Holland, hvorfra den nu har bredt sig til de nordeuropæiske farvande. Det er en ret alarmerende udvikling, som må følges nøje, fordi betydelige skadeeffekter på fiskeriet ikke kan udelukkes. I de sidste 20 år er temperaturen steget stødt i Nordsøen, og ikke mindst de seneste års varmerekorder har givet den invasive ribbegople særligt gode betingelser for at ikke blot at overleve, men også formere sig og stige i antal år for år.
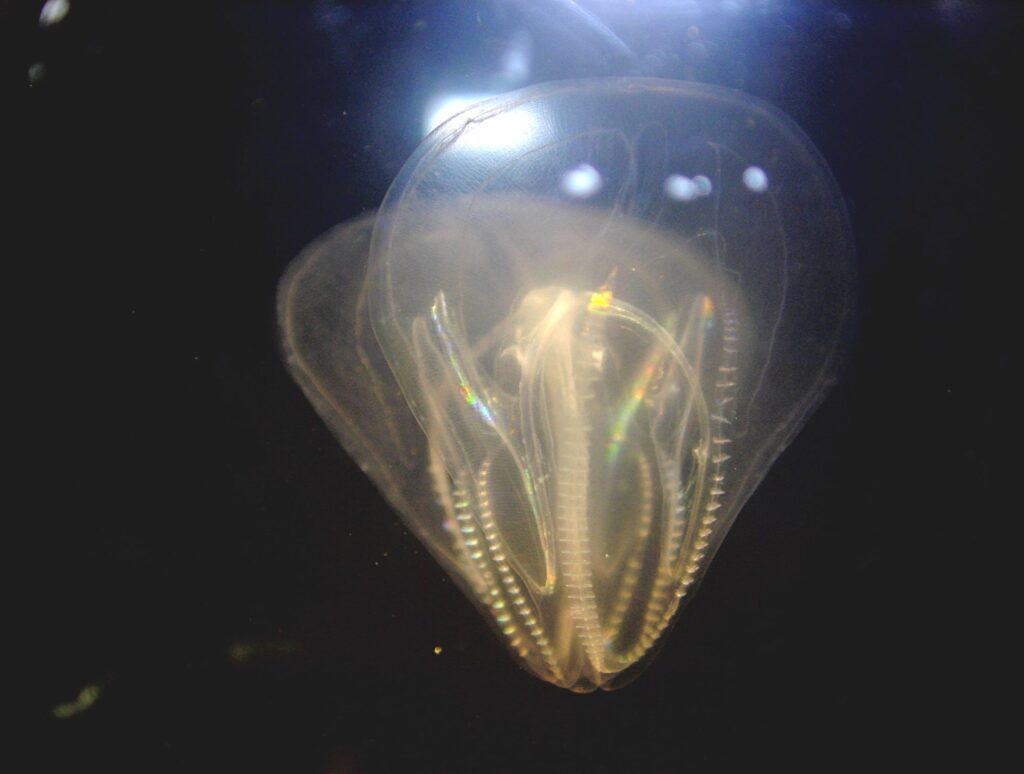
Ribbegoplen Mnemiopsis leidyi, fanget i Kerteminde Bugt den 16. marts 2007. Foto: Hans Ulrik Riisgård
Ribbegoplen nu i havet omkring Fyn
Fra Holland har ribbegoplen bredt sig i den sydlige del af Nordsøen og videre op i Skagerrak og Kattegat. I efteråret 2006 blev Mnemiopsis-ribbegoplen observeret langs den svenske vestkyst. I slutningen af februar 2007 blev den observeret i Lillebælt, og den 16. marts 2007 blev den 2-3 cm ægformede ribbegople registreret af Marinbiologisk Forskningscenter i indkommende vand fra Storebælt til Kerteminde Fjord. I de sidste 20-25 år er gennemsnitstemperaturen i havet omkring Fyn steget omkring 2 grader, og det er i biologisk sammenhæng temmelig meget. Måske er vandet nu varmt nok til at Mnemiopsis-ribbegoplen kan etablere sig med mange individer og med deraf følgende masseforekomst og mulige skader på fiskeriet. Det er dog også muligt, at det ikke går så galt, fordi ribbegoplernes naturlige fjende nummer ét, nemlig melongoplen, Beroe cucumis, allerede findes i vores farvande.
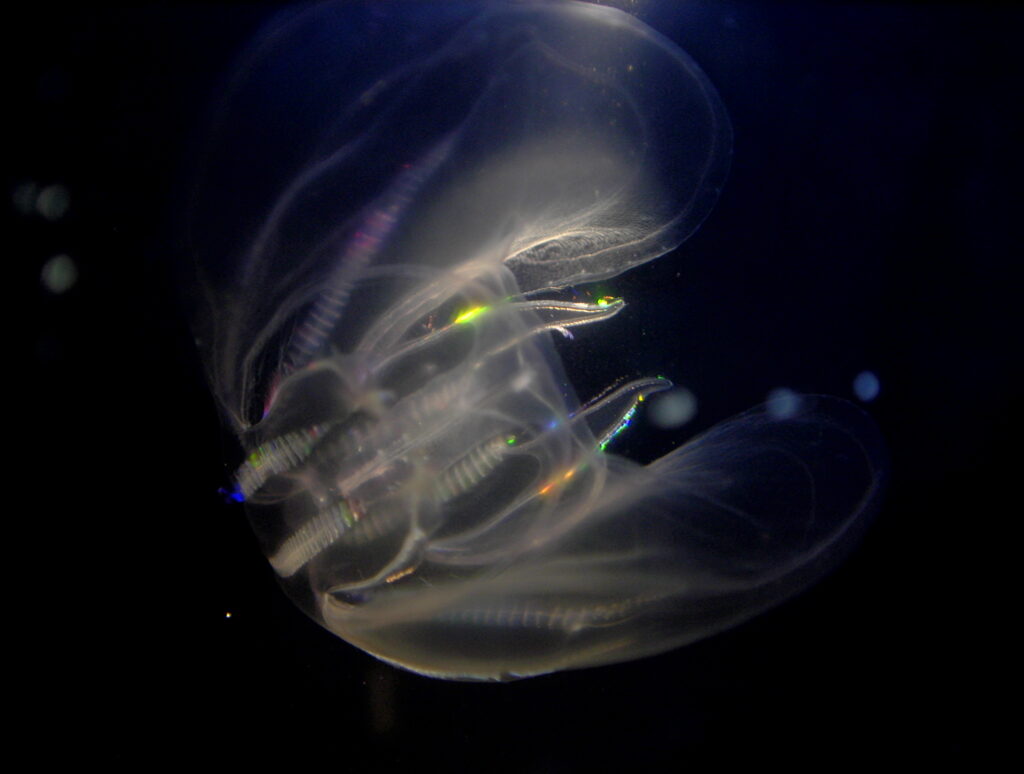
Ribbegoplen Mnemiopsis leidyi, fanget i Kerteminde Bugt den 16. marts 2007. Foto: Hans Ulrik Riisgård
Lidt om ribbegoplers biologi
Ribbegopler er kugle- eller ægformede, helt gennemsigtige, geléagtige dyr, der lever af zooplankton, fiskeæg og -larver. På overfladen findes 8 striber eller “ribber”, der løber fra pol mod pol. Hver ribbe består af en række små, tværstillede blade, der igen er sammensat af sammenklæbede kæmpe-cilier (fimrehår). Bladene er i stadig bevægelse og bruges til svømning. Under svømningen vender munden opad. De fleste ribbegopler som eksempelvis stikkelsbærgoplen Pleurobrachia pileus – men ikke Mnemiopsis leidyi – har to, ofte meget lange, grenede tentakler, der udspringer fra hver siden af den kugleformede krop. Tentaklerne er udstyret med klæbeceller (colloblaster); men mangler nældeceller som hos vandmænd, brandmænd og andre ægte gopler, som ribbegoplerne rent faktisk ikke er nært beslægtede med. I den modsatte enden af munden findes et ligevægts-organ (statocyst), som hjælper med at koordinere dyrets bevægelser ved at påvirke svømme-ribbernes bevægelser. Mnemiopsis-ribbegoplen har lige som sin nære slægtning Bolinopsis infundibulum to mund-lapper (oral lober), som anvendes til fangst af zooplankton og fiske æg og -larver (Waggett & Costello 1999, Costello et al. 1999). Ribbegoplerne er hermafroditter og danner både ægceller og spermatozoer, og de har muligvis selvbefrugtning. Larverne af nogle arter ribbegopler bliver kønsmodne og forplanter sig allerede inden de udvikles til normale voksne individer. Det betyder, at ribbegoplerne har en kolossal evne til at blive til mange individer, hvis føden og de rette betingelser er til stede. En ribbegople kan begynde at producere æg et par uger efter klækning, og i løbet af de følgende 10 dage, kan den producere op til 12.000 æg. Alle ribbegopler kan lyse i mørke (bio-luminescens), men man ved dog ikke, hvilken mulig funktion, den selvlysende effekt har (Riisgård 2007).

Mnemiopsis leidyi fanget i Kerteminde Bugt. Foto: Hans Ulrik Riisgård
Ribbegopler i danske farvande
I de danske farvande, fra Nordsøen til den vestlige Østersø, træffer vi ofte den lille “stikkelsbærgople” (Pleurobrachia pileus), der er kugleformet med en diameter på 1-2 cm og forsynet med 2 lange tentakler. Desuden findes også almindeligt forekommende “tolappet ribbegople” (Bolinopsis infundibulum), der er ægformet, 5-10 cm høj, og forsynet med to lapper, som den fanger sit bytte med. Denne almindeligt forekommende koldtvands ribbegople minder meget om ‘dræber-ribbegoplen’ (Mnemiopsis leidyi), som indtil for nylig ikke er set i de danske farvande. Faktisk kræver det nogen ekspertise at skelne de to arter af tentakelløse ribbegopler fra hinanden (se Fig. 2). Endelig findes i danske farvande “stor ribbegople” også kaldet “melongople” (Beroe cucumis), der er tøndeformet op til 10-15 cm lang (se Fig. 4). Den æder især andre ribbegopler, som den sluger gennem sin store spalteformede mund. Måske bliver melongoplen redningen for fiskeriet i de danske farvande, fordi melongoplen er Mnemiopsis-ribbegoplens fjende nummer ét. Først da melongoplen også blev indslæbt til Sortehavet, begyndte det at gå tilbage for den invasive Mnemiopsis-ribbegople. Se også de senere års undersøgelse af Mnemiopsis‘ forekomst og økologiske effekter i Limfjorden (Riisgård et al. 2007, 2012a&b&c).
Altfortærende grovæder
De første, mindste stadier af Mnemiopsis leidyi har to lange tentakler med sidegrene (tentakulat-stadium). Men når ribbegoplerne bliver større end 6-7 mm, degenererer de lange tentakler, og et nyt lobat-stadium dannes. Små fangst-tentakler langs læbekammen, der omgiver mundregionen, vokser frem samtidig med at mund-lapperne (oral loberne) bliver større. Denne metamorfose indebærer et skift i den basale mekanisme for byttedyrfangst. I tentakel-stadiet fanges byttedyrene, når de af sig selv svømmer ind i de lange, klæbende tentakler, der hænger stille eller langsomt trækkes efter ribbegoplen som et stort vod (“ambush feeding”). I det lobate stadium indfanges fiskeæg, muslingelarver og andre langsomme byttedyr i en vandstrøm skabt af vandpumpende cilier, hvorved byttet føres i kontakt med de små tentakler (tentilae), som omgiver mundregionen. Hurtigere byttedyr som vandlopper flygter væk, når de mærker et sug. Disse byttedyr fanges i stedet ved sammenstød med de store oral-lapper. Ved hjælp af kam-cilierne (“ribberne”) svømmer ribbegoplen fremad med mund-lapperne slået ud til siden, og når der opnås kontakt med en vandloppe eller et andet byttedyr, bøjer mund-lapperne sig indad, så byttet hastholdes. De to måder at fange bytte på gør, at Mnemiopsis-ribbegoplen er meget bredspektret i sit fødevalg – den er en altfortærende grovæder uden appetitregulering.
REFERENCER
Costello, J.H., Loftus, R., Waggett, R. (1999). Influence of prey detection on capture success for the ctenophore Mnemiopsis leidyi feeding upon adult Acartia tonsa and Oithona colcarva copepods. Marine Ecology Progress Series 191: 207-216
Faasse, M.A., Bayha, K.M. (2006). The ctenophore Mnemiopsis leidyi A. Agassiz 1865 in coastal waters of the Netherlands: an unrecognized invasion? Aquatic Invasions 1(4): 270-277
Huwer, B., Stoor-Paulsen, M., Riisgård, H.U., Haslob, H. (2008). Abundance, horizontal and vertical distribution of the invasive ctenophore Mnemiopsis leidyi in the central Baltic Sea, November 2007. Aquatic Invasions 3(2): 113-124. Download pdf
Riisgaard, H.U. (2007). Invasiv Mnemiopsis-ribbegople i danske farvande. Vand & Jord nr. 3, s. 89-90. Download pdf
Riisgård, H.U. (2008). Dræbergopler i danske farvande. Naturens Verden nr. 7/8, s. 2-9 Download pdf
Riisgård, H.U., Bøttiger, L., Madsen, C,V., Purcell, J.E. (2007). Invasive ctenophore Mnemiopsis leidyi in Limfjorden (Denmark) in late summer 2007 – assessment of abundance and predation effects. Aquatic Invasions 2(4): 395-401. Download pdf
Riisgård, H.U. L. Bøttiger, Madsen, C.-M. V. (2007). Forekomst og udbredelse af den invasive ribbegople Mnemiopsis leidyi i Limfjorden i august og september 2007 – vurdering af mulige effekter. Rapport fra Marinbiologisk Forskningscenter, Syddansk Universitet. 25. september 2007, pp. 47. Download pdf
Riisgård, H.U., Tendal, O. (2010) Invasive comb jellies (Mnemiopsis leidyi) in Danish waters. Pool32Mag, vol:2, pp. 212-225. E-publication in fly fishing e-magazine: published 25 September 2010 online, see link www.poll32mag.blogspot.com.
Riisgård, H.U., Jaspers, C., Serre, S., Lundgreen, K. (2012a). Occurrence, inter-annual variability and zooplankton-predation impact of the invasive ctenophore Mnemiopsis leidyi and the native jellyfish Aurelia aurita in Limfjorden (Denmark) in 2010 and 2011. BioInvasions Records 1(3): 145-159. Download pdf
Riisgård, H.U., Madsen, C.V, Barth, C., Purcell, J.E. (2012b). Population dynamics and zooplankton-predation impact of the indigenous scyphozoan Aurelia aurita and the invasive ctenophore Mnemiopsis leidyi in Limfjorden (Denmark). Aquatic Invasions 7: 147-162. Download pdf
Riisgård, H.U., Andersen, P., Hoffmann, E. (2012c). From fish to jellyfish in the eutrophicated Limfjorden (Denmark). Estuaries and Coasts 35: 701-713. Download pdf
Riisgård, H.U., Barth-Jensen, C., Madsen, C.V. (2010). High abundance of the jellyfish Aurelia aurita excludes the invasive ctenophore Mnemiopsis leidyi to establish in a shallow cove (Kertinge Nor, Denmark). Aquatic Invasions 5(4): 347-356. Download pdf
Tendal O.S., Jensen, K.R, Riisgård, H.U. (2007) Invasive ctenophore Mnemiopsis leidyi widely distributed in Danish waters. Aquatic Invasions 2(4): 455-460. Download pdf
Tendal, O.S., Riisgård, H.U., Jensen, K.R. (2007). Dræber-ribbegoplen i danske farvande – en folkelig undersøgelse. Dyr i natur og museum. Zoologisk Museum, nr. 2: 2-5. Download pdf
Waggett, R., Costello, J.H. (1999). Capture mechanisms used by the lobate ctenophore, Mnemiopsis leidyi, preying on the copepod Acartia tonsa. Journal of Plankton Research 21: 2037-2052
Waggett, R.J. & Sullivan, L.J. (2006). Feeding efficiency of the larval ctenophore Mnemiopsis leidyi A. Agassiz (Ctenophora, Lobata). Journal of Plankton Research 28: 719-723
Sagen om Flaske-Bent
- Arkivalier 2010 – 2013
- Arkivalier 2016
- Udsagn fra 19 beboere i Risum
Damernes Fornøjelse
Musik spillet af duoen Poul Kjellberg & Hans Ulrik Riisgård
Vores kendingsmelodi hedder Damernes Fornøjelse – så meget naturligt er Damernes Fornøjelse også navnet på vores duo!
Vi spiller gamle danske folkedansemelodier. Vi har et repertoire på 100 melodier arrangeret for to stemmer. Hans Ulrik spiller første stemmen (melodien) på harmonika, mens Poul spiller anden stemmen, enten på tværfløjte eller klarinet.
Folkedansemelodierne er en del af dansk kulturarv. Vi spiller rheinlænder, kvadrille, kontrasejre, totur, tretur, firtur, sekstur, hamburger, polka, hopsa, sønderhoning, trekantet sløjfe osv.
Vores musik egner sig også godt til en reception eller en hyggelig frokost, hvor der spises, drikkes og snakkes. Vi spiller ikke koncertmusik, men gerne en frokost- eller taffelmusik, hvor der må spises, snakkes og hygges, mens vi spiller i baggrunden.
Vi har hentet vores folkedansemelodier i nodesamlingen 358 Danske Folkedansemelodier, som er blevet brugt i mange år og vel nærmest obligatorisk for spillemænd. Således er Damernes Fornøjelse nr. 92 i nodesamlingen 358 Danske Folkedansemelodier.
Kontakt: Poul (+45) 30 13 20 56, Hans Ulrik (+45) 24 61 96 02
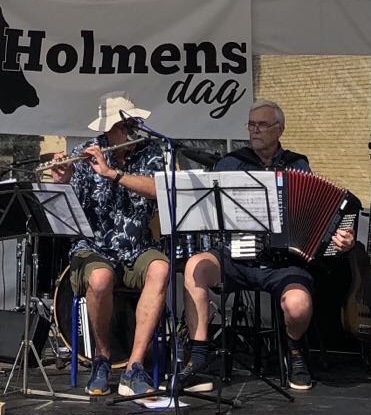
Frokostmusik til Holmens Dag den 7. september 2024 i Dalby
Damernes Fornøjelse koncert den 27. maj 2021 for Bibliotekets Venner i Kerteminde
NEWS!!!
I sommeren 2025 spiller vi i museumshaven, Farvergården, Langegade 8, Kerteminde, torsdag den 26. juni, 17. juli og 14. august kl. 13:30-15:30.
Hans Ulrik Riisgård
Ph.D. & D.Sc., Professor (em)

Marine Biological Research Centre
University of Southern Denmark (SDU)
Hindsholmvej 11
5300 Kerteminde
Denmark
Mobile: (+45) 24 61 96 02
E-mail: hur@biology.sdu.dk
